
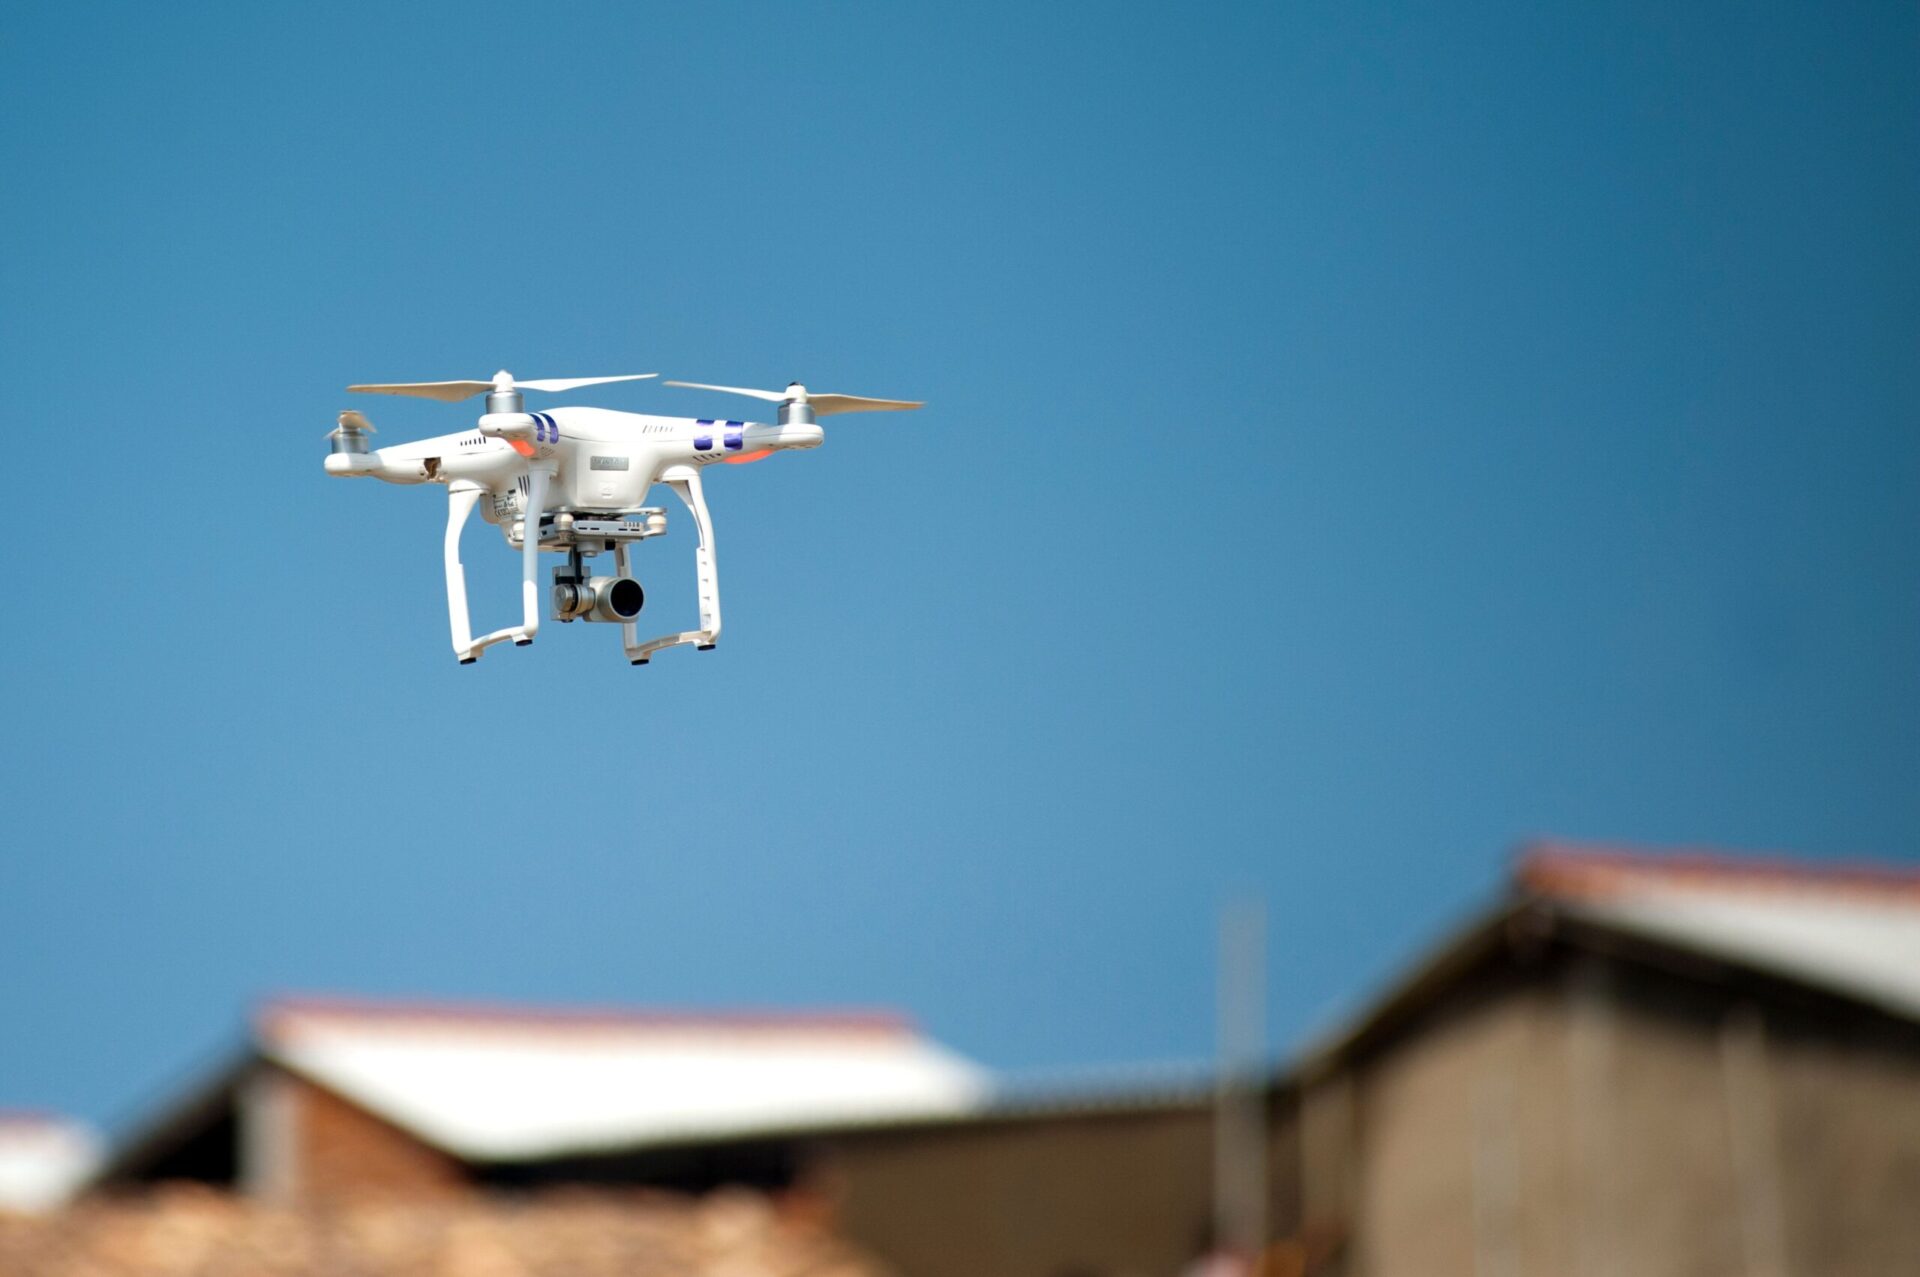
An uncomfortable truth lies behind the idea of using drone roof inspection and thermal surveys to predict moss growth: the conditions needed for a valid infrared moisture survey amount, roughly speaking, to the absence of the conditions that make moss grow.
ASTM C1153, the standard practice for locating wet insulation in roofing systems using infrared imaging, assumes a dry surface. A wet surface evaporates, evaporation cools, and that cooling drowns out the underlying thermal mass signal the survey is trying to read. Yet surface moisture is precisely the variable that determines whether a roof becomes covered in moss. The naive version of the pitch — fly a thermal camera, spot hidden moisture, predict the green — is therefore looking for the wrong quantity, under conditions that rule it out.
The useful version is more interesting, and it rests on an entirely different mechanism. Thermal imaging does not predict biological colonisation by finding water. It predicts it by mapping the thermal geometry that determines how long water stays on a surface once it has arrived there.
Roof moss removal: what really limits moss
Spores and propagules cost practically nothing: they arrive everywhere, all the time, carried by wind and rain. Light is rarely a limiting factor on a roof. Nutrients are scarce but sufficient, thanks to atmospheric deposition and accumulated organic debris. On a European pitched roof, the decisive constraint is almost always the same: the number of hours per year during which the surface is wet.
Corrosion science has had a formal indicator for this for decades. ISO 9223 defines time of wetness as the cumulative time during which relative humidity exceeds 80% and temperature exceeds 0 °C, and makes it one of the main factors in classifying atmospheric corrosivity. Applying that precise threshold to colonisation by bryophytes and algae is a matter of analogy rather than an established dose-response relationship, and I would not want to overstate its reach — but the underlying logic carries straight across. Two tiles of identical composition, on the same roof, exposed to the same rain, will develop in completely different ways if one stays wet for four hours longer every morning.
That divergence is something a thermal survey can genuinely see, because it is determined by surface temperature relative to the dew point.
Drone thermography: what a thermal image really measures
A long-wave infrared camera does not measure a temperature. It measures incident radiance in the band of roughly 8–14 µm and converts it into an apparent temperature using assumed values for the target’s emissivity and for the reflected apparent temperature of the surroundings. Any error in those assumptions feeds straight through to the result.
This matters more on roofs than on facades, because roof coverings span a considerable emissivity range (camera manufacturers such as Teledyne FLIR publish reference values by material family). Concrete and brick sit around 0.93–0.94, asphalt and bituminous surfaces around 0.90–0.98, water around 0.96 — all perfectly readable. But shiny galvanised sheet is around 0.23, and polished aluminium goes as low as 0.04–0.06. On a low-emissivity metal roof, the camera mostly images the reflected sky, and apparent temperature loses almost all meaning for this purpose.
On readable materials, moisture produces two distinct and opposite signals depending on when the flight takes place:
Evaporative cooling (daytime, wet surface). Water leaving a surface carries away about 2.4 MJ of latent heat per kilogram at ambient temperature. In sunshine, a damp area appears markedly cooler than its dry surroundings. This is a strong, unambiguous signal — but it tells you the surface is wet now, which you could often see with the naked eye.
Thermal capacitance lag (night-time, after sunshine). This is the ASTM C1153 mechanism: during the day, the roof absorbs solar radiation; after sunset, it cools by radiating to the sky; areas with higher water content, and therefore higher heat capacity, cool more slowly and appear warmer. This signal reveals moisture at depth — wet insulation within a flat roof build-up — and it requires a dry surface to work.
Note that these two signals have opposite polarities. A damp patch is cold by day and warm by night. Reporting a ‘cold anomaly’ without stating the time of capture and the sunshine history that preceded it does not constitute an interpretable result.
Drone roof inspection at dawn: the dew-point margin map
Here is the measurement that actually delivers on the original promise.
Fly the drone in the last hour before sunrise, after a clear, windless night. Every part of the roof has radiated to the sky, and radiative loss varies with the sky view factor — the fraction of the hemisphere above a given point occupied by open sky. A ridge sees almost the whole sky and cools well below air temperature. A north-facing slope under a mature lime tree sees much less sky and cools less, but also receives no morning solar gain to warm it back up. A valley, a shaded pitch behind a dormer, a junction at the foot of a parapet: each combines sky view factor, wind exposure and local thermal mass in its own way.
At that moment, the thermal image gives you a spatial map of surface temperature. Pair it with a simultaneous measurement of air temperature and relative humidity, calculate the dew point, then subtract. You get a dew-point margin map: for every square decimetre of roof, how far above or below the condensation threshold the surface was at the coldest point of the daily cycle.
Areas at or below the dew point are areas that were actively collecting condensation — not rain, not runoff, but atmospheric water deposited directly. Cross-reference this with morning sunshine, which determines how quickly that deposit evaporates, and you get a physically grounded ranking of the parts of the roof that accumulate the most hours of wetness per year. That ranking is the leading indicator. It exists before any visible colonisation, because it describes the environment rather than the organism.
The same physics is well documented on facades, where external wall insulation (EWI) systems cool at night below air temperature, because the render skin has very low thermal mass and is thermally decoupled from the building. On a roof, the equivalent driver is usually geometry and shading rather than insulation, but the mechanism — radiative cooling under a clear sky, followed by condensation — is identical.
The limitations of thermography for drone roof cleaning
This is the part that determines whether the technique is worth commissioning, and it is far from trivial.
Thermal bridges hardly concern the roof coverings people want cleaned. Thermal bridge logic comes from thermography of facades and warm roofs, where heat from a heated interior creates a locally warmer or cooler outer surface. A ventilated cold roof — the dominant residential construction across much of northern and central Europe — has an insulated ceiling and a ventilated loft beneath the tiles. Practically no interior heat flow reaches the covering. Looking for thermal bridges on tiles means looking for a signal that the construction has deliberately suppressed. Where it is a warm roof, or an insulated converted loft, the thermal bridge signal reappears; otherwise, it does not.
Survey conditions are a go/no-go criterion, not a formality. Building envelope thermography under EN 13187 and the associated good-practice guides generally requires something like a 10 °C difference maintained for 24 hours, surfaces shielded from direct sun for at least four hours, wind below about 10 m/s and dry surfaces throughout the survey. For the dew-point margin map, the temperature difference requirement matters less, but the sunshine, wind and precipitation constraints are, if anything, even stricter — wind destroys the boundary layer that allows surfaces to cool below air temperature. Across much of Atlantic and north-western Europe, the number of nights per year that meet all these conditions is genuinely limited.
Both spatial resolution and radiometric accuracy are tight for this task. Uncooled microbolometer sensors mounted on an onboard gimbal typically offer 640×512 pixels, a thermal sensitivity (NETD) of a few tens of millikelvins and an absolute radiometric accuracy of the order of ±2 °C or ±2% — specifications vary by sensor and should be checked rather than assumed. Relative sensitivity is satisfactory; it is absolute accuracy that is the problem, because a dew-point margin of 1–2 K is significant and sits within the error bar. Reliable temperature measurement also requires the target to cover several pixels, so fine details — a single cracked tile, a narrow valley — may fall below the effective measurement resolution, even when they are visible in the image.
Confounding factors abound. A difference in emissivity between a mossy tile and a bare one, residual heat from a flue or a vent outlet, a warm roof window, the thermal shadow of a neighbouring building, or moisture held within the covering itself all produce anomalies that cannot be distinguished from the one you are looking for. ASTM C1153 deals with this problem by requiring destructive verification by coring of the suspected wet areas. For a roof cleaning application, the equivalent verification is simply to go up and look — which reintroduces the access cost the survey was supposed to avoid.
A single flight is a snapshot, not a prediction. The dew-point margin map from a single night, under a single set of atmospheric conditions, is only a weak indicator of the annual number of hours of wetness. The technique only becomes truly predictive with repeated captures under comparable conditions, so that change detection, rather than absolute values, carries the signal — which multiplies the cost and the scheduling difficulty.
Preventive moss removal: the complementary sensor nobody talks about
If the goal is early detection rather than prediction, multispectral imaging (from a drone such as the DJI Mavic 3 Multispectral, for example) is probably the better-suited instrument. Chlorophyll produces a marked jump in reflectance between red and near-infrared — the ‘red edge’, around 700–750 nm — detectable well before a biofilm stands out to the naked eye against a grey or terracotta background. Research teams, notably at Ghent University with work on facade biocolonisation using hyperspectral and RGB imaging, are actively developing classification methods for exactly this problem, although I have not seen published, validated detection thresholds specifically for roof coverings.
The two sensors answer different questions, with different lead times. Thermography maps the precondition: it offers the longest lead time, but the weakest inference. Multispectral detects the organism at low biomass: the lead time is shorter, but the inference is far more direct. Used together on the same flight, they provide more information than either on its own.
Drone roof cleaning in Europe: differences by climate
The value of the technique is not uniform across the continent. In Atlantic and north-western Europe — Ireland, western Britain, Brittany, western Norway —, surface moisture is almost ever-present, colonisation almost continuous, and mapping small differences in dew-point margin provides less information, since almost everything is wet. In continental and Alpine Europe, where clear, calm nights are frequent and daily temperature ranges are large, the signal is strong and survey conditions are often met. In Mediterranean Europe, where biological growth is a winter phenomenon and summer the dormant season, a survey carried out in the wrong half of the year measures a system that is not active.
Anti-moss treatment and thermography: why it is still rare, and what could change
It is worth being honest about why this practice remains uncommon, because the reasons are technical, not cultural.
There is no validated model linking a measured dew-point margin, or a number of hours of condensation, to a rate of colonisation on a given roof covering. Without that transfer function, a thermal survey produces a ranked map of risk areas, but cannot convert it into a treatment date. The chain of inference — thermal anomaly, therefore wetter, therefore faster colonisation, therefore treatment in month X — is physically reasonable at every step and quantified at none.
What would change things is nothing spectacular: repeated surveys of the same building under controlled conditions, coupled with records of intervention dates and observation of recolonisation, accumulated over several years. That is a longitudinal dataset, not a sensor upgrade. The hardware has been good enough for some time; it is the evidence that has not kept up.
When a thermal drone roof inspection is really justified
Thermal survey data are worth acquiring when the roof is large enough for differentiated treatment to make economic sense — treating the two problem slopes rather than the whole envelope; when it is a warm roof or a flat roof, where the ASTM C1153 mechanism applies and moisture at depth is in itself a real financial risk; when the covering has an emissivity above about 0.85, which rules out shiny metal; when the building is on a planned inspection cycle allowing repeated captures; and when someone is actually going to act on a differentiated result rather than treat uniformly whatever happens.
They are not worth it for a single small ventilated pitched roof, where a visual inspection, combined with knowledge of orientation and overhanging vegetation, will tell you the same thing for less; when the climate keeps the whole roof damp most of the time; or when the survey would be a one-off, with no baseline to compare it against.
To sum up honestly, thermal mapping here is a prioritisation tool, with a solid physical basis but a thin empirical one. It is a perfectly reasonable tool, provided it is presented for what it is: a map of where water lingers, not a forecast of when the moss will arrive.